
Analysis of future droughts in Northeast Lower Saxony
We analyze the frequency of droughts in our model region of Northeast Lower Saxony based on future climate model projections for three emission scenarios. As an indicator for droughts, we use the soil moisture index (SMI) down to a depth of 1m. The SMI is calculated using the mesoscale hydrologic model (mHM) developed at the Helmholtz Centre of Environmental Research (UFZ). This indicator is also used for the German Drought Monitor (https://www.ufz.de/index.php?en=37937) and is suitable to represent agricultural droughts.
Frequency of soil droughts in 88 model ensembles
The mesoscale hydrologic model was driven by 88 climate model projections related to 3 climate change scenarios: a high emission scenario (RCP8.5) with no climate change mitigation, a medium emission scenrio (RCP4.5) with little climate change mitigation, and a low emission scenario (RCP2.6) with much climate change mitigation. The soil moisture to 1m depth is then converted to a soil moisture index that is suitable for mapping agricultural droughts. A drought is present when the SMI < 0.2; a severe drought is present when the SMI < 0.1.
In Fig. 1, we show a 30-years running average of the number of months per year and for the growing season in which the SMI < 0.2 to indicate drought and SMI < 0.1 indicating severe drought.
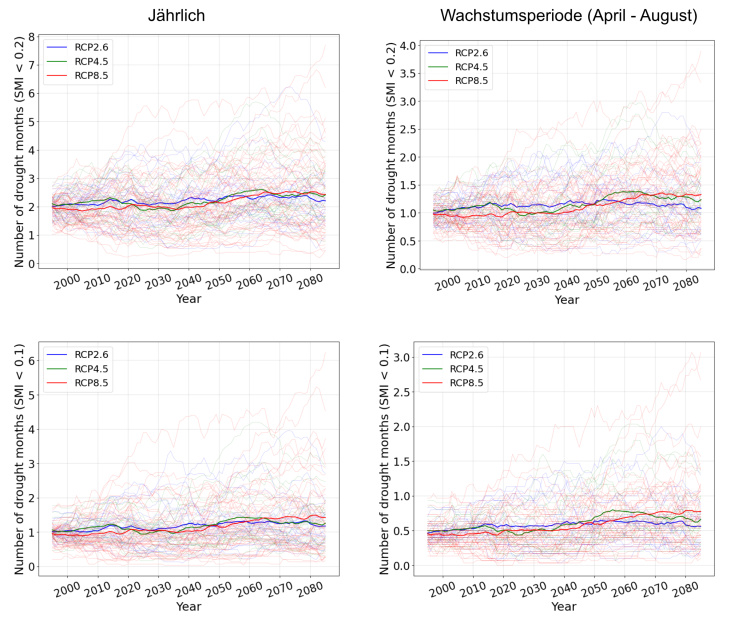
Fig. 1: 30-years running mean of the number of drought months annually (left) and for the growing season (right) for SMI < 0.2 and SMI < 0.1. Thin lines indicate individual models and thick lines the model mean for the respective RCP.
We find that number of drought months will increase in all scenarios from 2 to around 2.45 for RCP8.5 and 2.2 for RCP2.6 annually and from 1 to 1.35 for RCP8.5 and 1.1 for RCP2.6 during the growing season. Severe drought months (SMI < 0.1) will increase from 1 to 1.2 for RCP2.6 and 1.45 for RCP8.5 annually. For the growing season, they will increase from 0.5 to 0.6 for RCP2.6 and from 0.45 to 0.8 in RCP8.5. Hence, we find the strongest increase in severe drougths for RCP8.5 during the growing season.
In Fig. 2, we examine how frequently a drought event as in 2018 will occur in the future. To do this, we calculate the mean SMI for summer (June, July, August) 2018, i.e. SMI (JJA) = 0.045. Note that the SMI indicates a very severe drought well below 0.1. We then highlight the years with a mean summer SMI below 0.045 in each model (met indicates the different model ensemble runs) for the different RCPs.
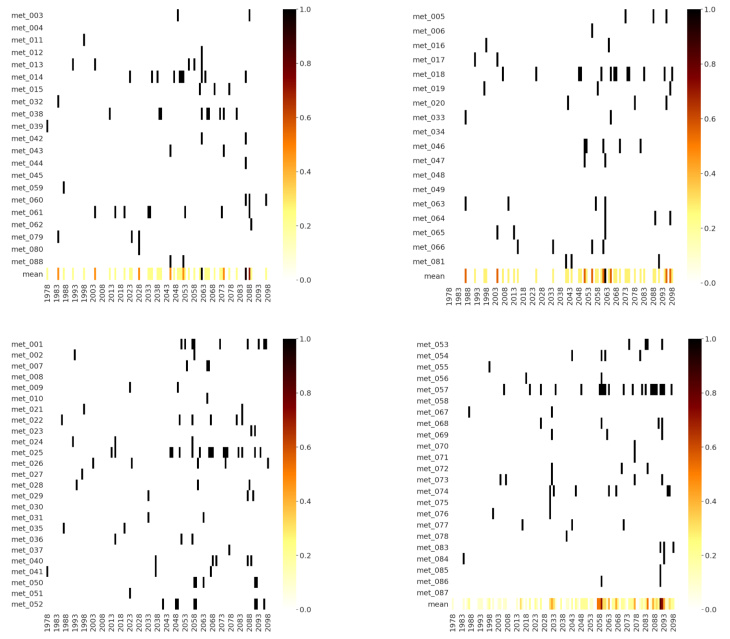
Fig. 2: Model ensembles (met) for RCP2.6 (top left), RCP4.5 (top right), and RCP8.5 (bottom) and years for which drought like 2018 is projected with SMI < 0.45 during summer months (June-August).
We find that the frequency of agricultural droughts is much higher for RCP8.5 compared to RCP2.6 and RCP4.5.