
Agricultural submodel
In the first part of the project, a qualitative system dynamics model was co-developed together with the stakeholders. In the second part, we quantify the relations between system components to be able to simulate and test different climate and management scenarios. Therefor, we develop a stock-and-flow diagram from the qualitative model. For the agricultural part, soil moisture and capital are important stocks. Soil moisture impacts plant growth and thereby the yield. The yield determines the farmers‘ profit.
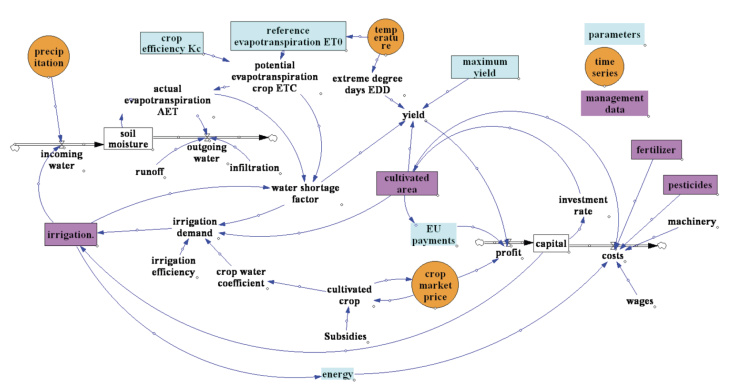
Fig. 1: First sketch of the agricultural submodel including parameters, time series and management data.
Statistical yield function of precipitation and temperature
A key relation of the agricultural model is the one between yield and seasonal weather. To quantify this relation, we use a linear least square regression model with precipitation and temperature as explanatory variables to determine the seasonal yield.

Y ... yield
r ... region (7 counties: Harburg, Lüneburg, Uelzen, Lüchow-Dannenberg, Celle, Heidekreis, Rotenburg (Wümme))
m ... month (4=April ... 8=Oktober; vegetation period for Germany, see Trapp et al. (2013))
i ... year (yield data for Lower Saxony available from 1950, for counties from 1978, climate era5 data from 1979)
k ... crop (potato, sugar beet, corn, wheat)
pr ... precipitation
tas … daily mean temperature
To verify the statistical approach, we want to compare the calculated yield with data. We got annual yield data for potatoes in Uelzen from 1979 until today from the Chamber of Agriculture Lower Saxony. Due to intensification and technical progress in the agricultural sector, there is a positive trend in yield per hectare for the last centuries. Because we want to determine yield changes as a function of climate variability, we use a Gaussian filter to detrend the yield.
Detrending yield due to technical progress
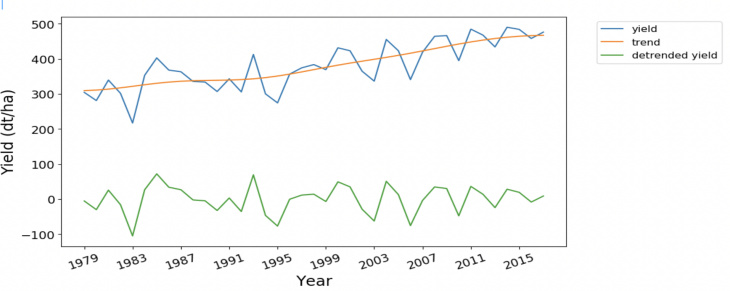
Fig. 2: Potato yield between 1979 and 2017 for Uelzen, detrended using Gauss filter.
Comparing statistical yield function with yield data
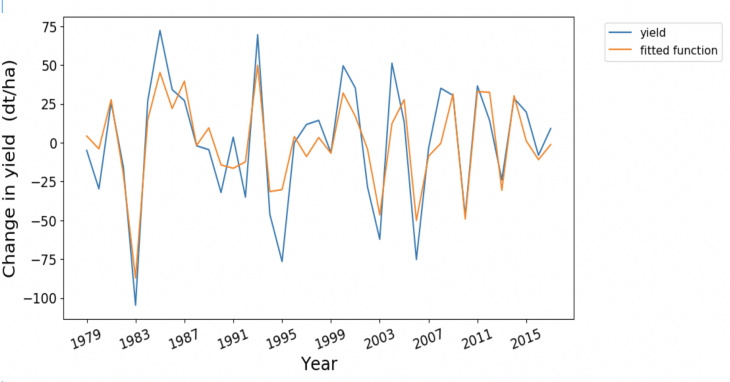
Fig. 3: Detrended potato yield between 1979 and 2017 for Uelzen and second order fitted function of precipitation and temperature
Future yield projections
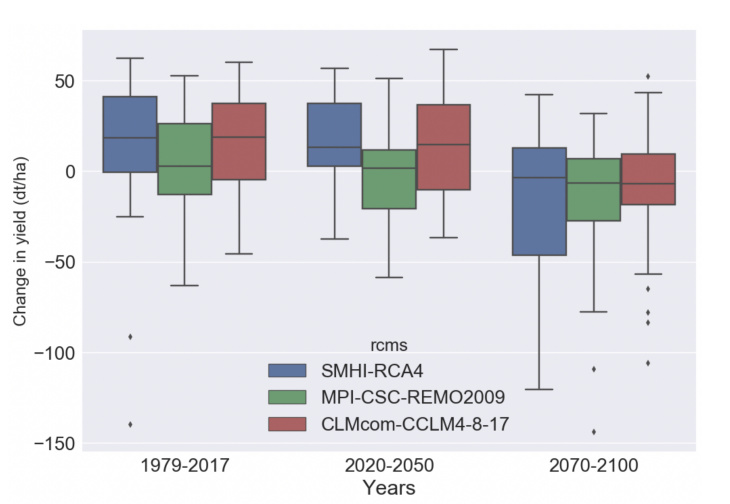
Fig. 4: Changes in yield according to yield projections using a statistical approach and climate model data for RCP 8.5 for potatoes in the district of Uelzen for the time periods 1979-2017, 2020-2050 and 2070-2100 compared to yield data from the Chamber of Agriculture