
Frost becomes rare in future climate
Background Information
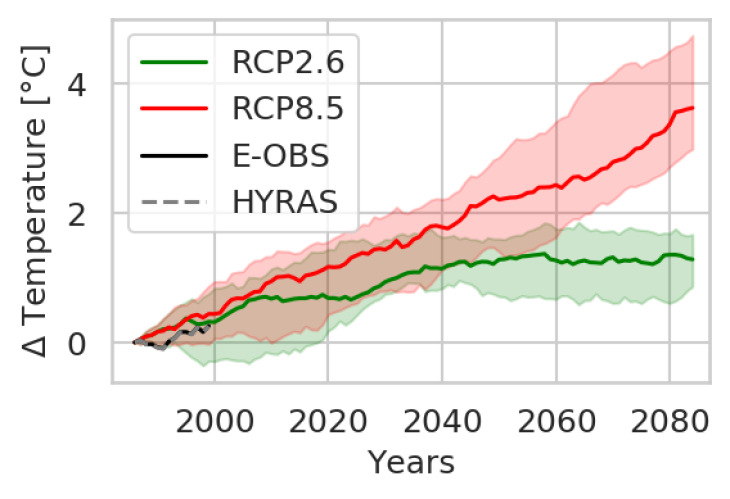
Figure 1: Average temperature changes relative to the reference period 1971-2000. Average temperatures are calculated for the city of Hamburg and its rural surroundings. Green, red: Ensemble of regional climate model results for two different climate scenarios. Shadings represent the 25th to 75th percentile. Black, grey: Two gridded data sets based on station data [3], [4].
The analysis is based on an ensemble of regional climate model results. This ensemble is a result of the European branch of the international Coordinated Downscaling Experiment initiative [1].
Results for two different climate change scenarios, representing different concentration pathways (RCPs) [2], are analysed. RCP2.6 is a scenario where emissions are reduced and radiative forcing peaks in the mid of the century, RCP8.5 is a scenario where greenhouse gas emissions continue to increase throughout the century. The area of interest is the city of Hamburg and its rural surroundings.
Here, results for the cold season are analysed, defined as the time between the 1st of November and the 31st of March of the following year.
Results
Average cold season temperatures within the area of interest further increase, independent of the scenario (Figure 1). However, in RCP2.6 the average temperature stabilises after 2040 at an increase of around 1.3 °C compared to the reference period 1971 to 2000 (median value of model ensemble at the end of this century). Cold season climate indices show: the number of ice days, maximum number of consecutive ice days, frost days, maximum number of consecutive frost days all decrease for both scenarios. In RCP2.6 the decrease is less pronounced than in RCP8.5 and for RCP2.6 the decrease stabilises after 2031-2060 [6]. For RCP8.5 the decrease continues with the most pronounced decrease for the number of frost days per cold season [6]. While on average 68 frost days occurred during a cold season in the reference period, 25 to 50 frost days per cold season will remain at the end of this century. A decrease of approximately 43 days per cold season translates to a reduction in frost of around 1.5 months.
Definitions [5]
Ice day – A day on which the daily maximum temperature is below 0 °C.
Consecutive ice days – One ice day occurs after the other. The maximum number of consecutive ice days is determined for each cold season.
Frost day – A day on which the daily minimum temperature is below 0 °C.
Consecutive frost days – One frost day occurs after the other. The maximum number of consecutive frost days is determined for each cold season.
References
- [1] EURO-CORDEX: https://www.euro-cordex.net/
- [2] RCPs: https://www.ipcc-data.org/guidelines/pages/glossary/glossary_r.html
- [3] E-OBS: https://cds.climate.copernicus.eu/cdsapp#!/dataset/insitu-gridded-observations-europe?tab=overview
- [4] HYRAS: https://www.dwd.de/DE/leistungen/hyras/hyras.html
- [5] Climate indices: https://www.ecad.eu/download/millennium/millennium.php
- [6] Bell L , K.H. Schlünzen and K. Sieck (2020), Influence of data uncertainty on cold season threshold based climate indices. In preparation for International Journal of Climatology